
A management reporting framework defines who sees what information, when, and why — replacing ad-hoc reporting with a structured system that executives can trust cycle after cycle. Without structure, reporting becomes noise: inconsistent metrics erode trust and delay decisions. The framework consists of five components: report hierarchy (strategic to operational), audience mapping, content standards with consistent metrics and terminology, frequency cadence aligned with decision cycles, and clear ownership with accountability for production and approval. Decision-usefulness is the primary measure of a report’s success — not volume, not visual appeal, not the technology behind it. For mid-market companies, this framework eliminates the predictable problems of rebuilt reports, conflicting numbers, and governance gaps that consume finance teams.
Purpose & Context
A management reporting framework is a structured approach to organising, producing, and delivering reports that support management decisions. Unlike ad-hoc reports created for specific requests, a framework provides consistent, reliable information that executives can trust cycle after cycle.
This article anchors the Management Reporting cluster within the Knowledge Hub, providing the foundation for understanding how structured reporting enables better decisions.
Definition
Demo Company
January–August 2025 · consolidated · EUR thousands
Every P&L line is up sharply — but cash is €2.9m negative and working capital has swollen 34%. The profit is real; it hasn't turned into cash.
Fix the cash position before it bites
Cash at (€2,941), −27% YoY — growth is consuming cash faster than profit is generating it.
Release the working capital
Up +€1,835 (+34%) to €7,173 — receivables and stock are absorbing the earnings.
Protect the expanding margins
Gross margin 36% (+14 p.p.), EBITDA margin 19% (+6 p.p.) — the unit economics are strengthening.
Deterministic numbers from your governed model · AI-drafted · controller-reviewed before release.
Detailed analytics →A management reporting framework consists of:
- Report hierarchy: Strategic reports for leadership, operational reports for managers
- Audience mapping: Clear definition of who sees what information
- Content standards: Consistent metrics, formats, and terminology
- Frequency and timing: Regular cadence aligned with decision cycles
- Ownership: Clear accountability for production and approval
The framework distinguishes management reporting from statutory financial reporting. While statutory reports serve compliance, management reports serve decisions.
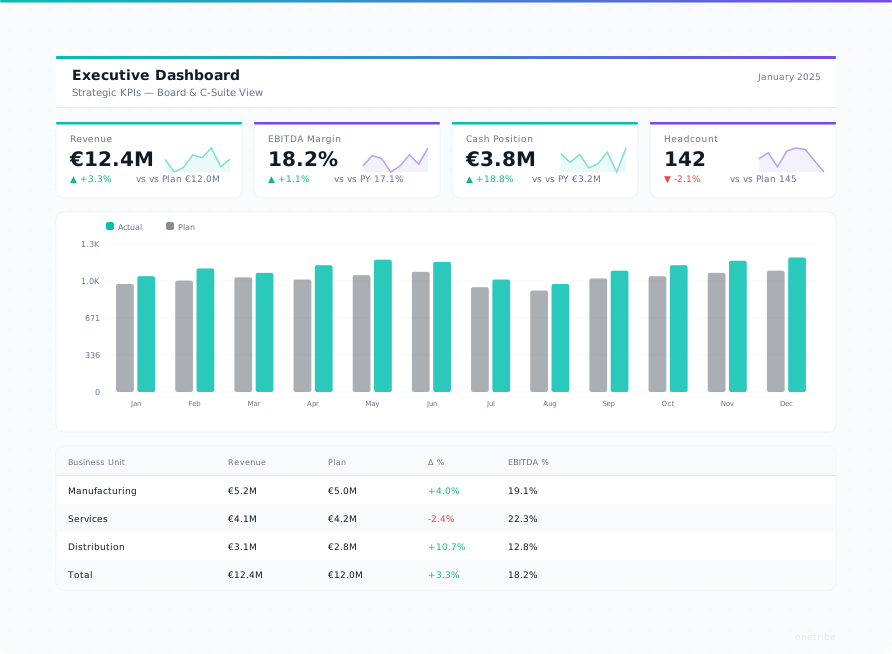
Executive Dashboard
High-level KPIs, trend lines, exceptions only
Monthly
Aligned with board cycle
CFO approves
Final sign-off before distribution
Department detail
P&L by function, budget vs actual, variance breakdown
Functional leaders
Tailored to decision authority and responsibility
Weekly
Management review cadence
Leads validate
Department heads own accuracy
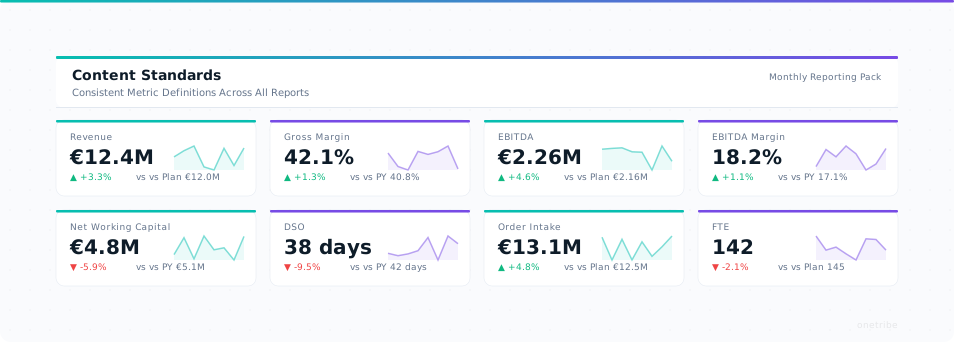
Content Standards bind all levels — same metric name = same calculation = same format
Operational Reports
Transaction-level data, daily metrics
Daily
Real-time or same-day
Teams produce
Data entry, report generation
Volume is highest here — but without a framework, so is the noise
Why This Matters
Organisations without a coherent framework face predictable problems:
- Decision delays when reports are inconsistent or require explanation
- Trust erosion when the same metric shows different numbers in different reports
- Wasted effort when reports are rebuilt from scratch each cycle
- Governance gaps when no one owns the reporting process
A well-designed framework eliminates these issues by establishing structure before the first report is produced.
Key Components
Report Hierarchy
Structure reports from strategic to operational:
- Executive dashboard: High-level KPIs for board and C-suite
- Management reports: Detailed analysis for functional leaders
- Operational reports: Transaction-level data for daily decisions
Audience Mapping
Define who sees what:
- Not everyone needs the same information
- Tailor content to decision authority and responsibility
- Avoid one-size-fits-all reports that satisfy no one
Content Standards
Establish consistency:
- Standard metric definitions (same name = same calculation)
- Consistent formatting and visualisation
- Required context (prior period, budget, benchmark)
Frequency and Cadence
Align timing with decisions:
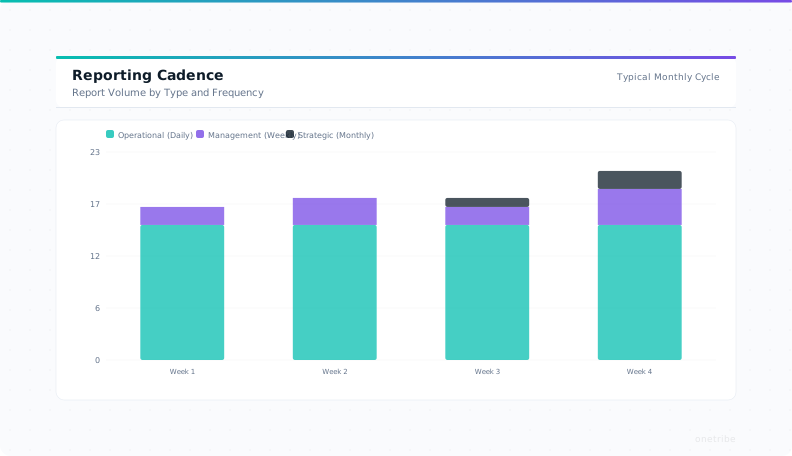
- Daily reports for operational decisions
- Weekly summaries for management review
- Monthly deep-dives for strategic planning
Ownership and Accountability
Clarify responsibilities:
- Who produces each report
- Who validates the data
- Who approves for distribution
Common Pitfalls
Avoid these frequent mistakes:
- Treating all audiences the same: Executives and analysts need different views
- Over-reporting: Volume without insight creates noise, not clarity
- Under-defining metrics: Same name, different calculation destroys trust
- Confusing reporting with analysis: Reports present facts; analysis interprets them
- Ignoring manual effort: The cost of creating reports should be tracked and minimised
Frequently Asked Questions
What software do I need for management reporting?
Start with that question and you’ll buy the wrong thing. The tool is the last decision, not the first — you choose it once you know who the reports are for, which KPIs matter, and how often you report. For most mid-market companies the honest progression is simple: Excel while you’re still working out what to report; a BI tool like Power BI once the structure is stable and the manual work starts to hurt; and a governed data layer once you’re consolidating several entities or systems and need one version of the numbers every day, not once a month. The common trap is buying Power BI first — then discovering it just visualises the same messy data faster. Fix the inputs, then pick the tool.
Where This Fits in Our Expertise
Management reporting frameworks are the structural backbone of the Reporting pillar . They ensure that what happened in the business is communicated reliably, consistently, and in a decision-ready format.
Without a framework, even sophisticated BI tools produce inconsistent outputs. With a framework, organisations build the foundation for automated, trusted reporting.
Summary
- A framework defines who sees what, when, and why
- Without structure, reporting becomes noise
- Decision-usefulness is the primary measure of success
- Frameworks reduce effort and increase trust
- Every report should have a clear owner and audience
Further Reading
- Reporting Expertise - Our approach to management reporting
- Glossary: Management Reporting - Term definition
- Glossary: KPI - Key Performance Indicator definition